
Lock down air pollution
How lockdown measures in Europe and Asia changed nitrogen dioxide emissions


Sentinel-5 satellite
824km altitude
Sentinel-5 is a satellite launched with a purpose to monitor air pollution in the atmosphere. Using ultraviolet waves, it's able to detect nitrogen dioxide (NO2).
Troposhpere
0-12km altitude


Why measure NO2?
NO2 is a gas with a short life span of only a couple of hours, this makes it easy to monitor the source of the pollution. Every time fossil fuels are burned, NO2 will be emitted into the air. This way it's easy to monitor where the most emissions are and what the possible causes can be.
Where does NO2 reside?
NO2 resides in both the troposphere and the stratosphere, we will only be monitoring the troposphere. In the troposphere the changes are mostly the result of human activities.
Comparing cities in times of COVID-19
Comparing cities in times of Covid-19. Because of Covid-19, a lot of normal human activities have been suspended. This suspension had a lot of impact on the NO2 emissions.


Before you make use of our comparison tool...
Let us introduce you to the mechanics of it or go straight to the charts
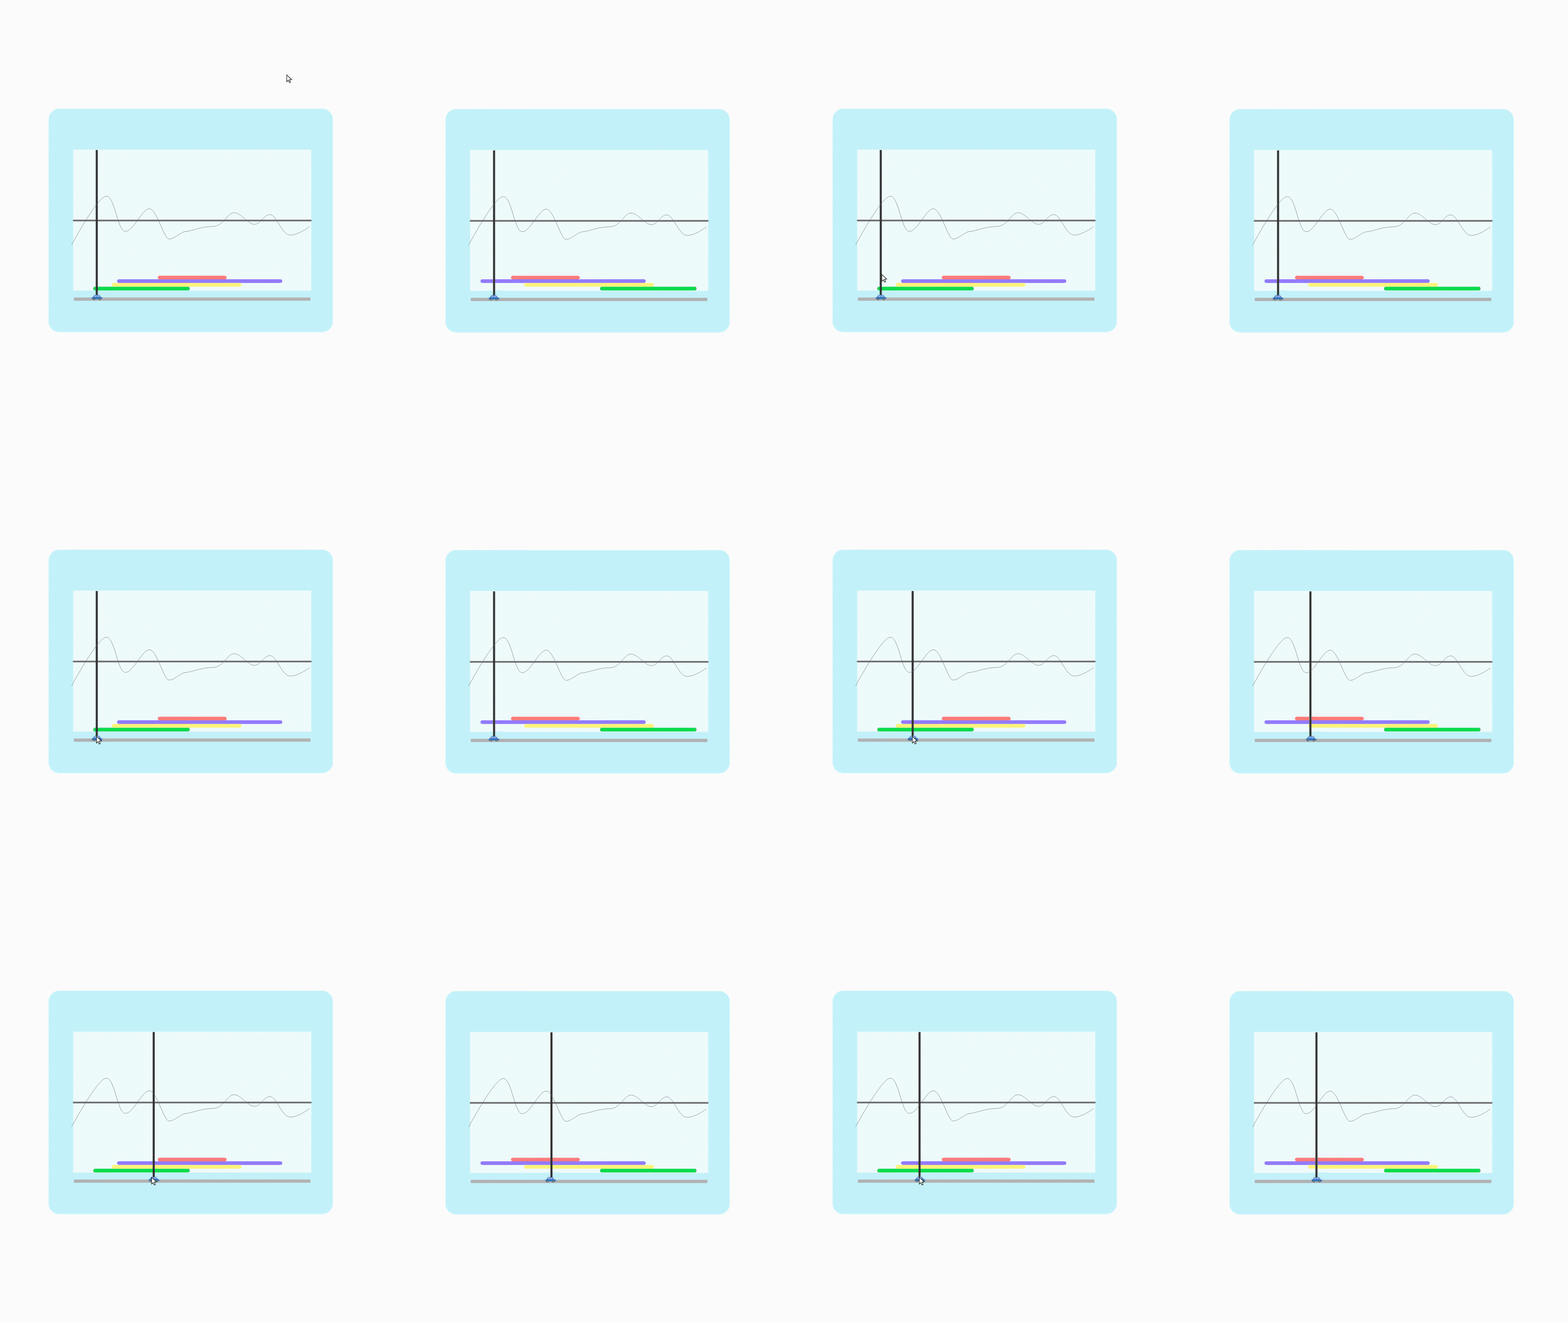
Hover over the chart
Whenever you hover over one of the charts with your mouse, the other one will follow along with the week you are currently hovering on.
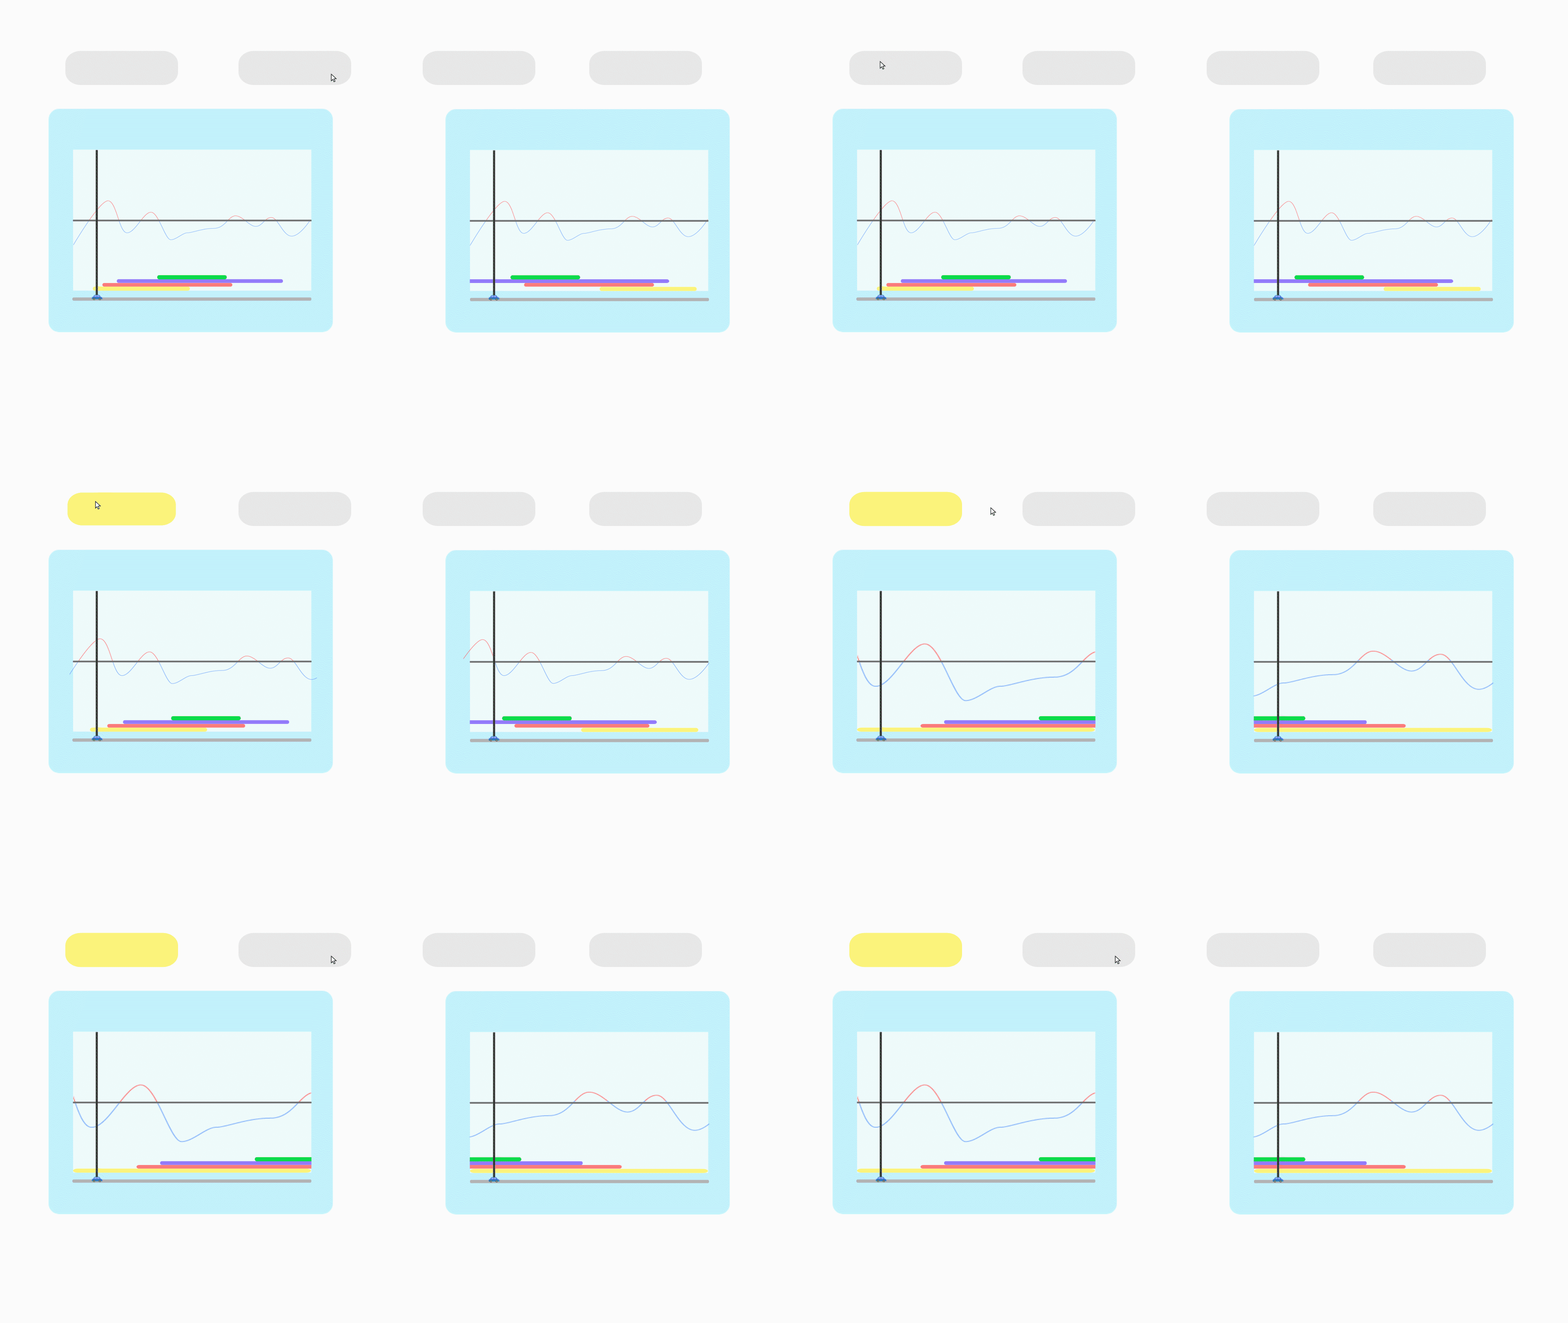
Select a COVID-19 measure
You can choose which measure you want to compare the cities with. The chart will automatically zoom in based on the length of each measure.
Or...
Click on the colourful bars
They do the exact same thing as when you click on the buttons.
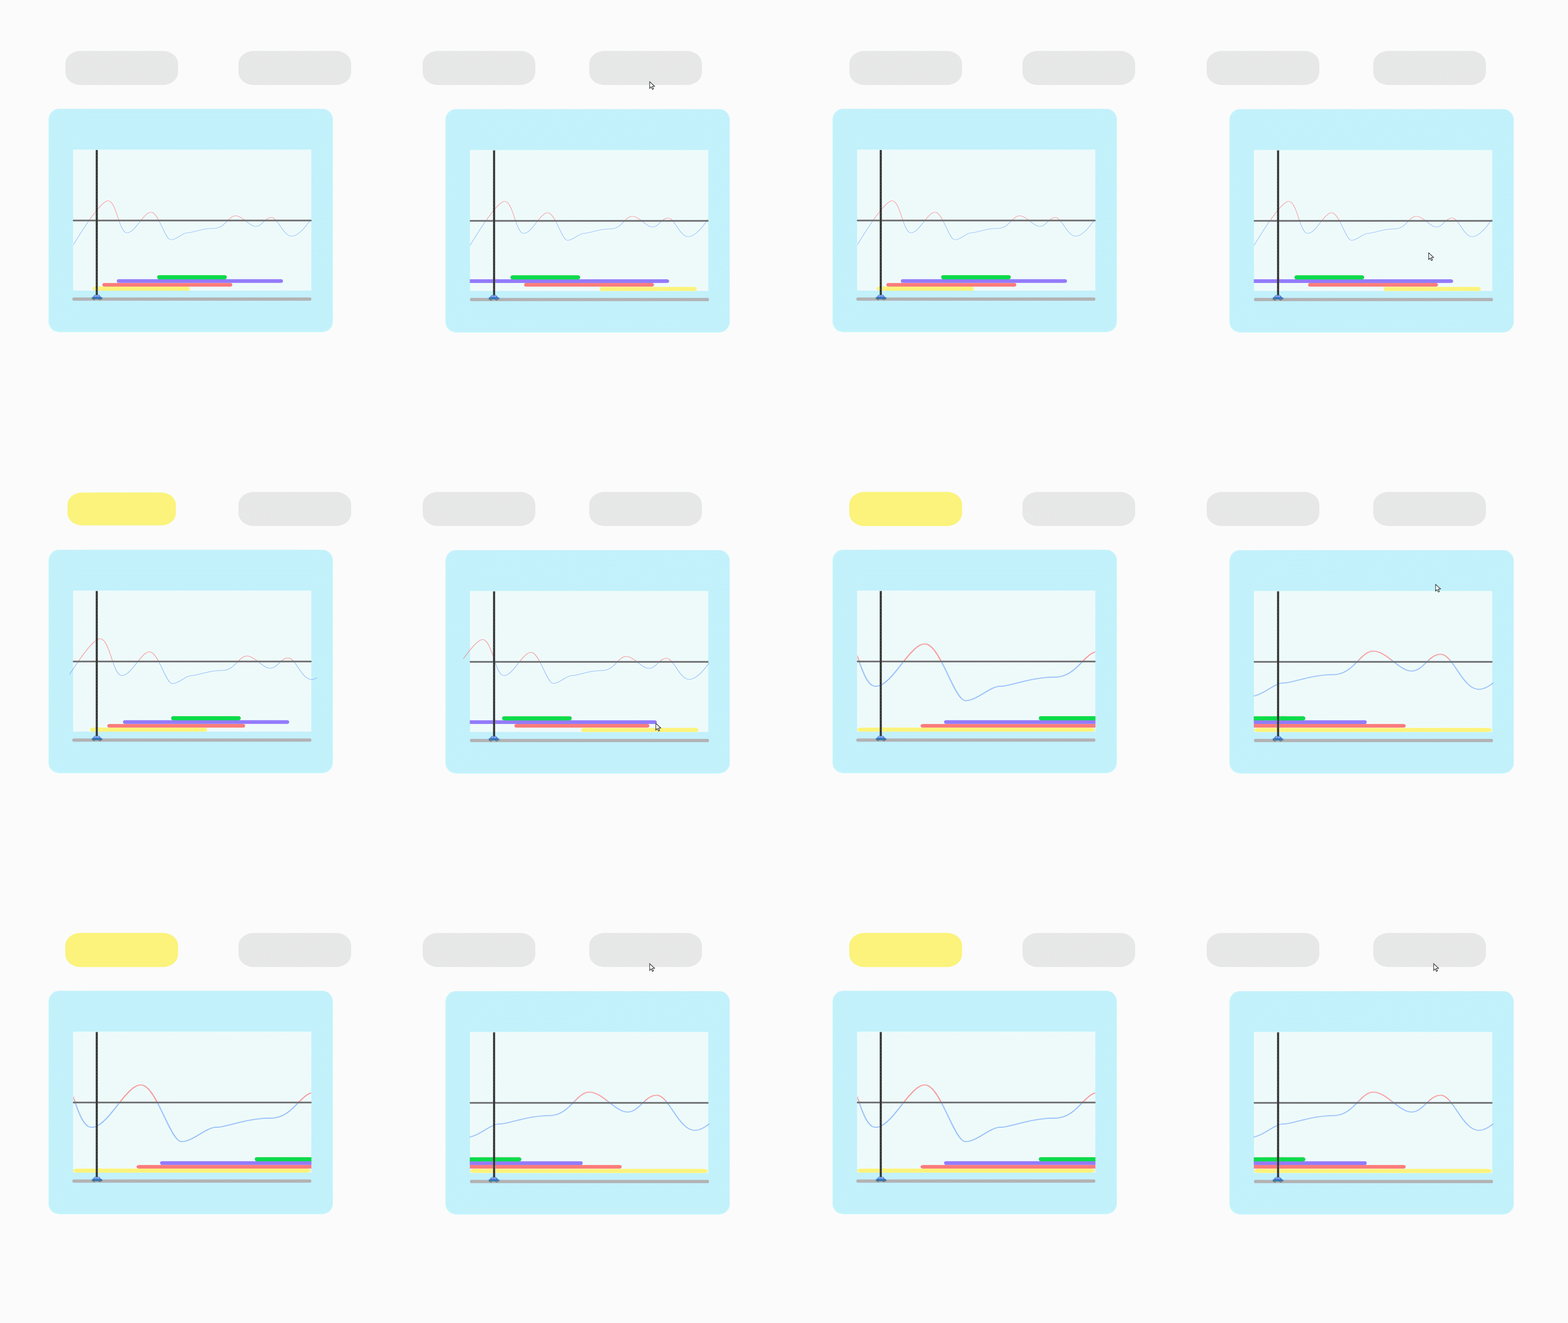
See the amount of measures taken
The darker the bar, the more measures have been taken within that time period. When you hover over a bar, you can see which measures were active in that period.

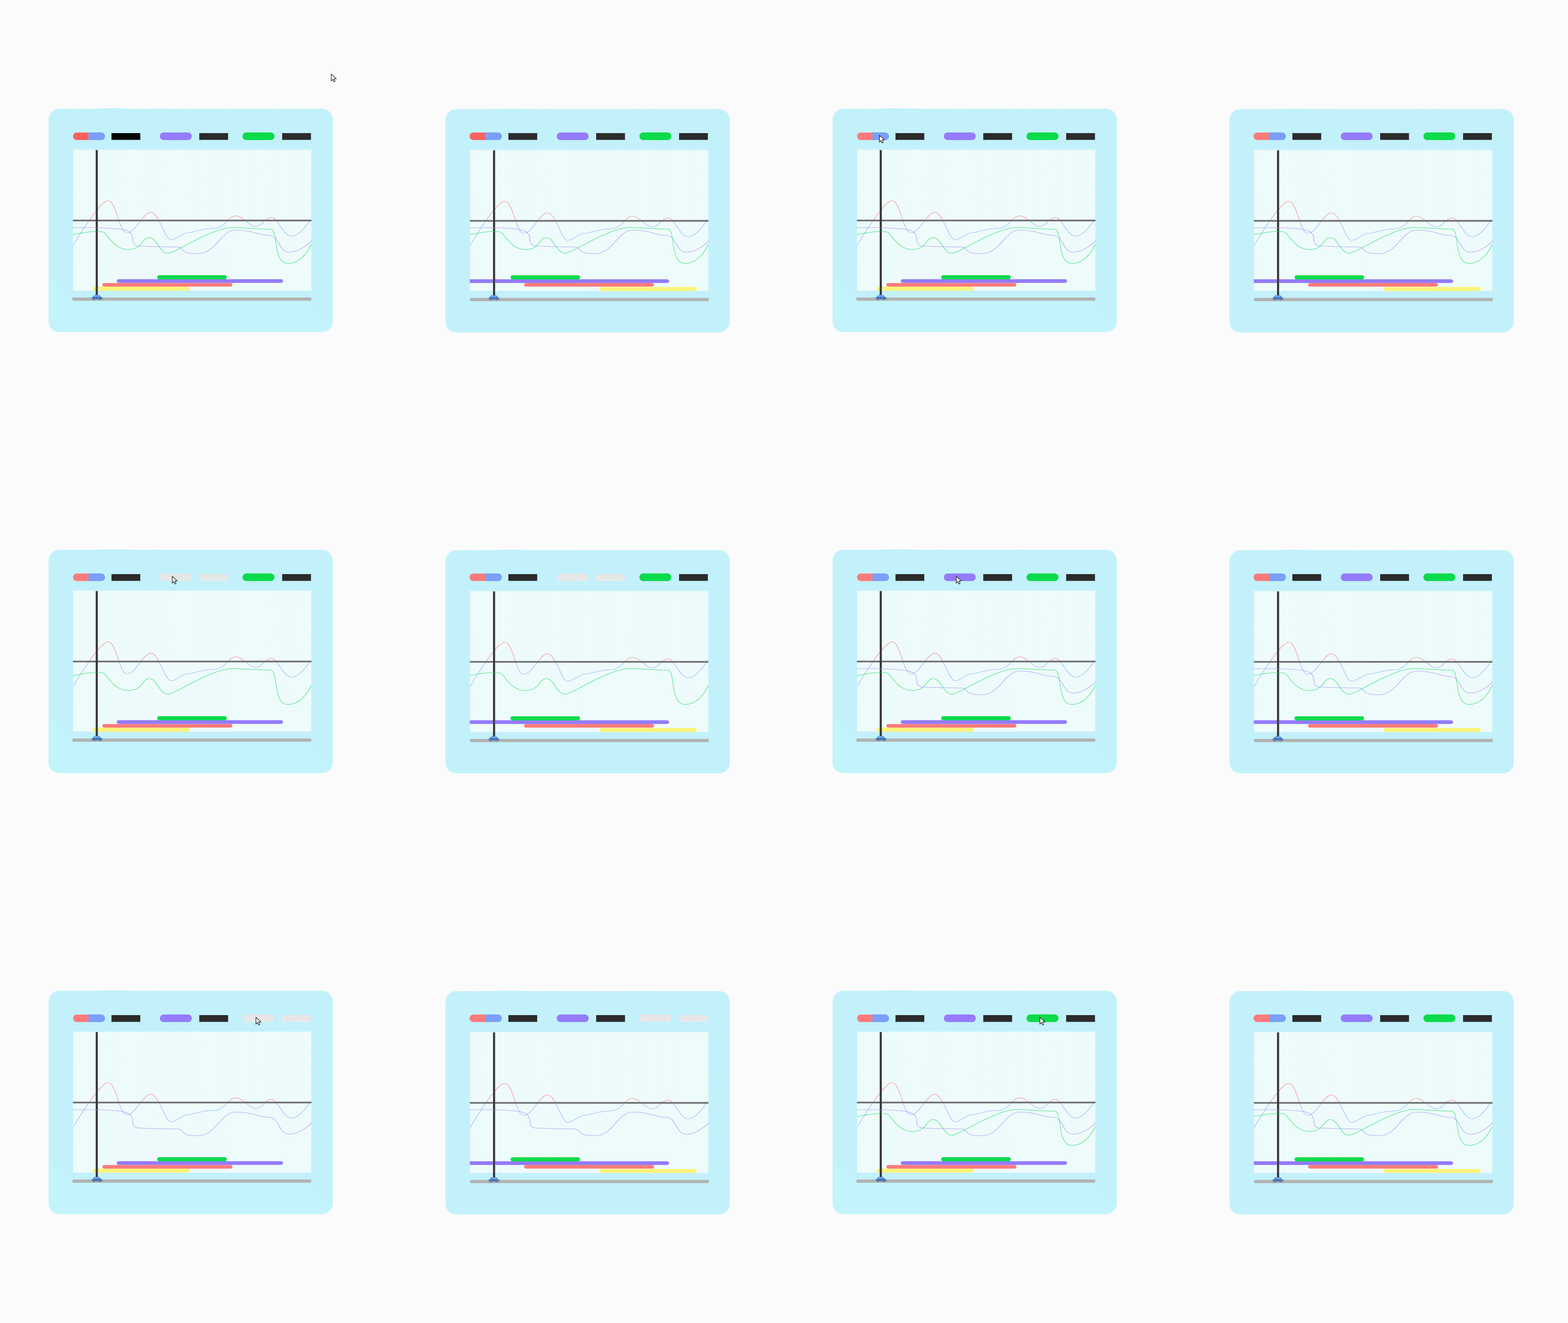
Close in on the data
Filter out the data you don't need by clicking on the labels.
Choose a COVID-19 measure to zoom in to
movement Restrictions
social Distancing
quarantine Isolation
stay At Home Orders
lockdown
Milan

NO2 Emission difference *

Amount of flights difference *

Road congestion difference *

Stringency Index (?)
* Difference is 2020 data vs 2019 data in percentages
Tokyo

NO2 Emission difference *

Amount of flights difference *

Road congestion difference *

Stringency Index (?)
* Difference is 2020 data vs 2019 data in percentages
Our most notable findings
Severity of lockdown greatly matters in NO2 reduction
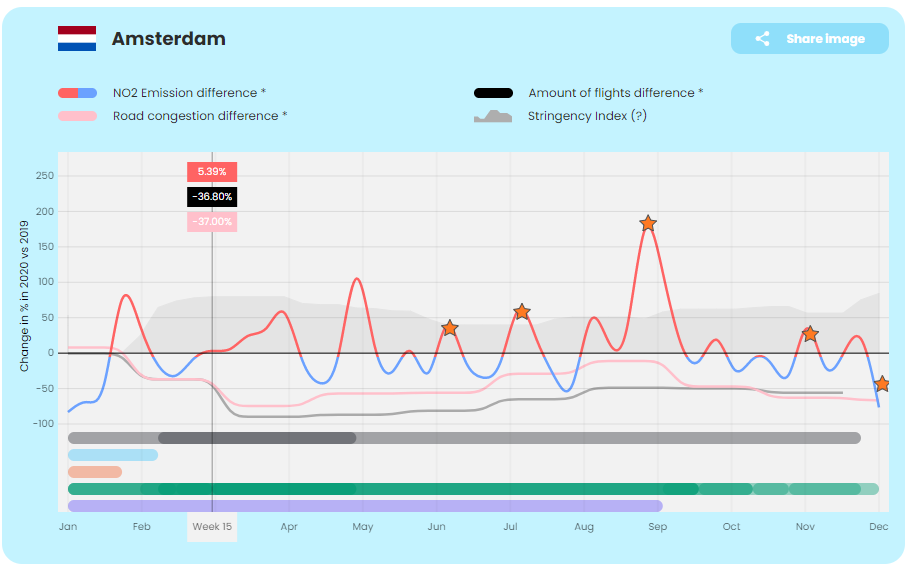

In Amsterdam, the severity of the lockdown was a lot less than in New Delhi. As you can see, there is no clear downtrend visible in NO2. Near the end of the year, a more severe lockdown was put into place. There is a clear drop in NO2, which might be the result of the more strict rules (as can be seen from the rising stringency index).
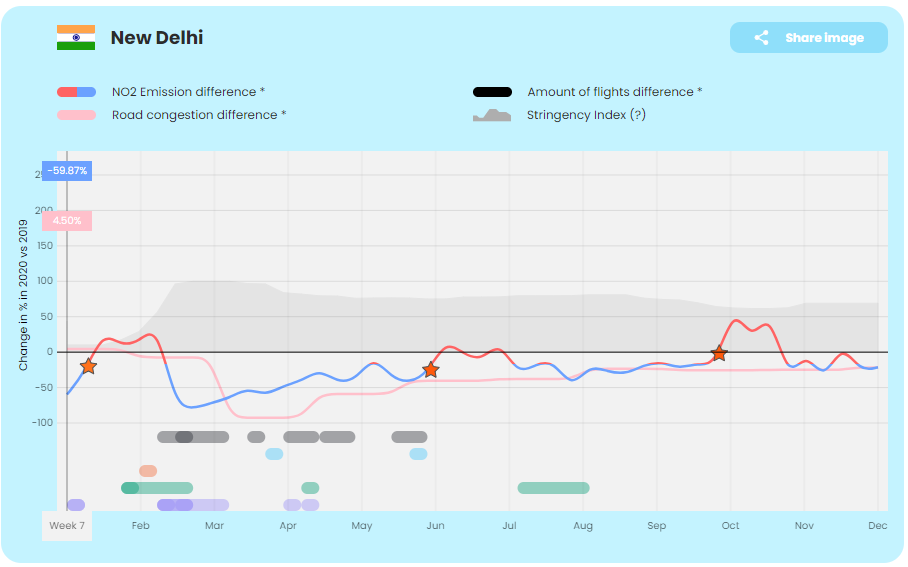

In New Delhi, the lockdown was quite intense in March already. The trend at the start of the measures is clearly down, indicating that strict lockdown measures in which only agriculture and companies around agriculture could continue to operate has a strong effect on NO2 emissions.
Black lives matter protests
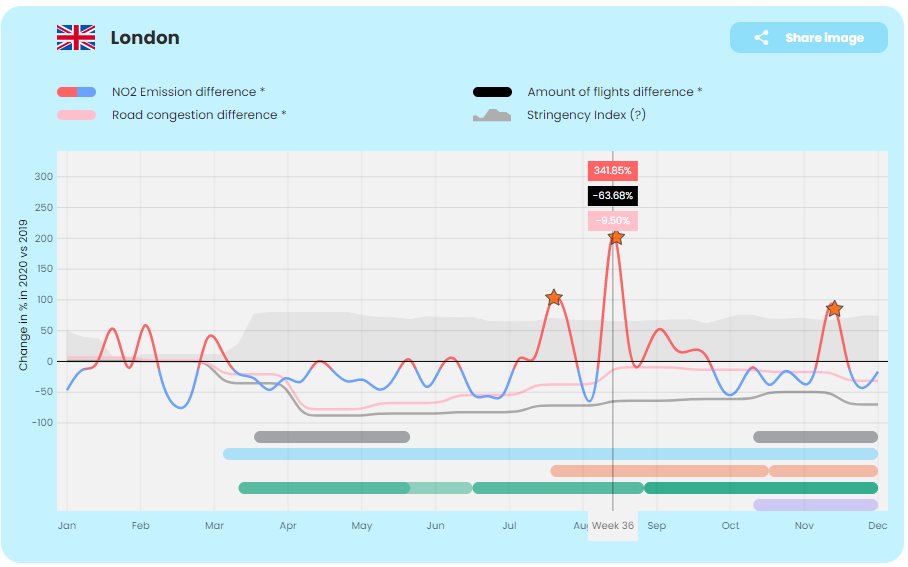
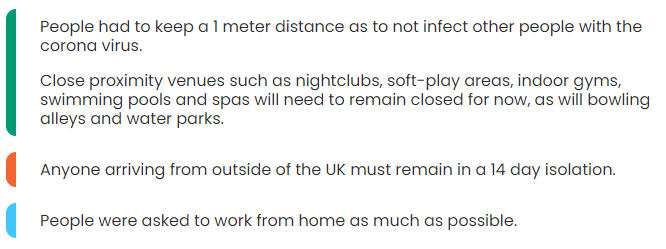
In London, while a lot of measures were still active, there were big Black lives matter protests going on in August 2020. This is the only reason this dramatic increase in NO2 emission can be explained. The protests must have caused a lot of people to travel towards London, which caused extra emissions.
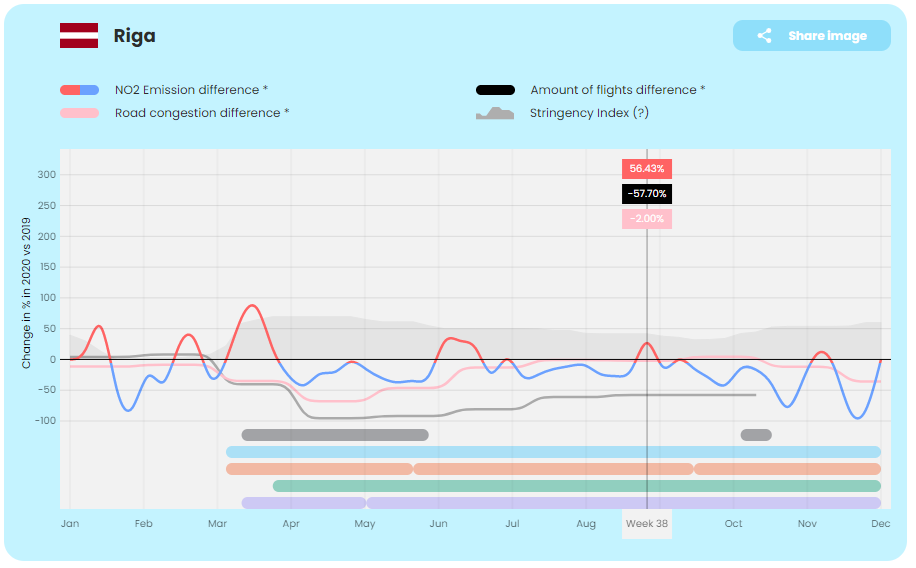
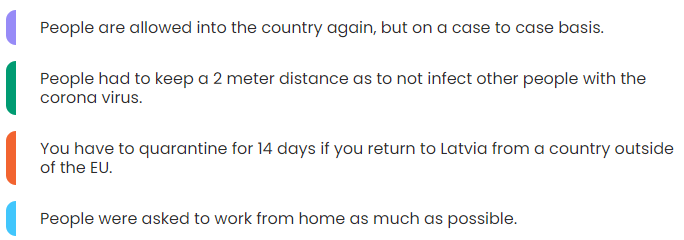
In Riga there was only a small increase in NO2 compared to London, although a 50% increase in comparison to previous year is still high. The reason for the increase might have been less COVID infections and more cars on the road again.
No measures, but a strong decrease in NO2
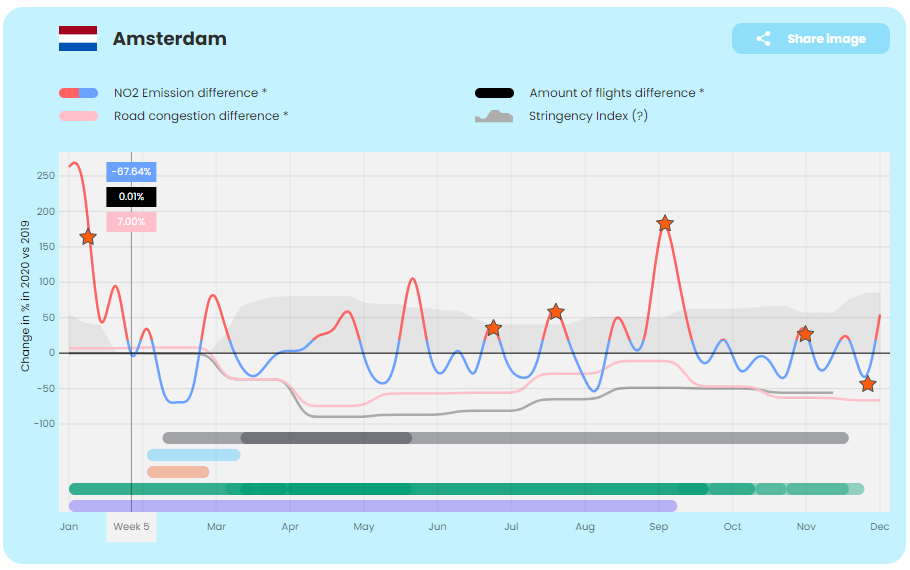
In Amsterdam, there were barely any measures, but the NO2 values did go down dramatically. The reason for this is unclear, because we did not find any major events that might have caused these changes.
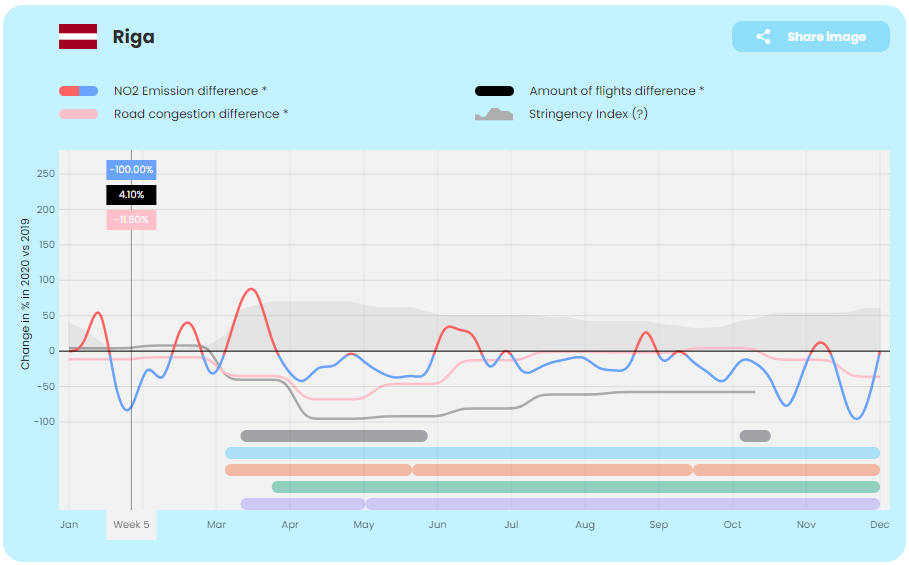
In Riga, same as in Amsterdam, the NO2 values decreased a lot at the start of the year compared to 2019. Because it's a comparison between two years, the reason cannot simply be winter time, because this happens in every year.
Stringency index has a clear relation to the NO2 emissions
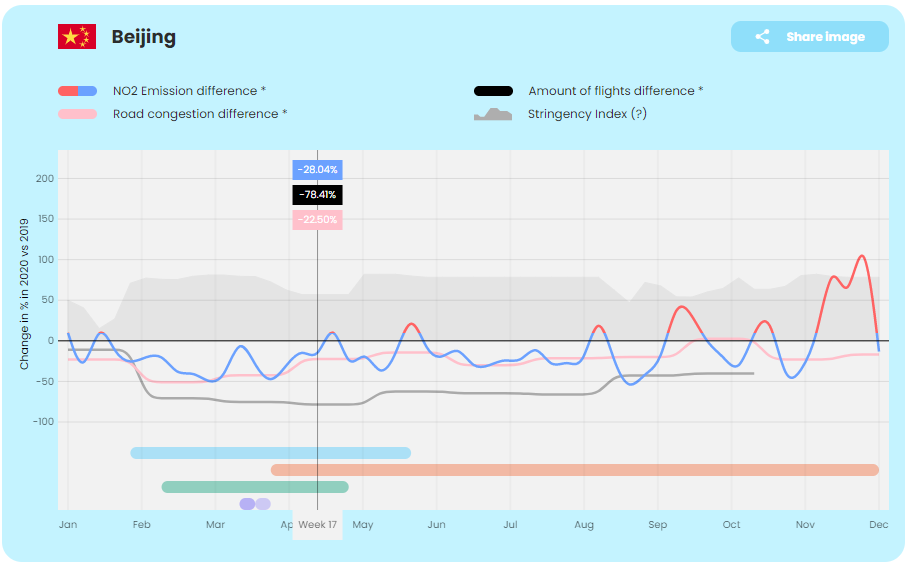
In Beijing, China, the government was a lot more strict with the implemented rules than Tokyo. You can clearly see when the stringency index goes down here, the NO2 levels can see a rise again.
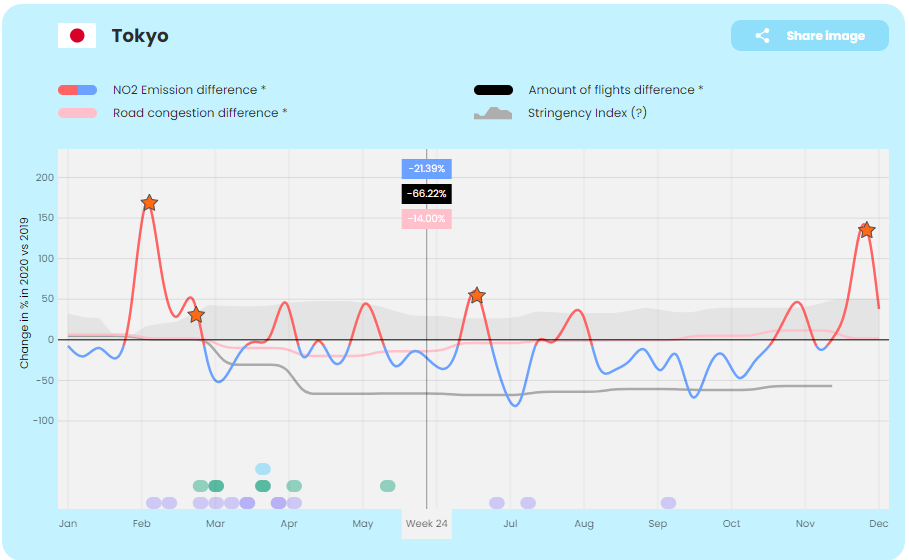
In Tokyo, the stringency index never moves above 50%, so the strictness of the rules applied here don't have that much of a correlation to the NO2 values.
Reference list
Satellite information
KNMI R&D Satellite Observations. (n.d.). Home. Tropomi. Retrieved 7 December 2020, from http://www.tropomi.eu/
NO2 metrics
Google. (n.d.). Google Earth Engine. Google Earth Engine. Retrieved 7 December 2020, from https://earthengine.google.com/
Data COVID-19 measures
BBC News. (2020, April 7). Coronavirus: The world in lockdown in maps and charts. https://www.bbc.com/news/world-52103747
Wikipedia contributors. (2021, January 9). National responses to the COVID-19 pandemic. Wikipedia. https://en.wikipedia.org/wiki/National_responses_to_the_COVID-19_pandemic
COVID-19 Government Measures Dataset. (2020, December 10). ACAPS. https://www.acaps.org/covid-19-government-measures-dataset
Drury, C. (2020, August 29). Anti-lockdown, anti-vaccine and anti-mask protesters crowd London’s Trafalgar Square. Independent. https://www.independent.co.uk/news/uk/home-news/coronavirus-anti-lockdown-protest-trafalgar-square-anti-vaccine-mask-hoax-a9695561.html
Stubley, P. (2020, August 31). Hundreds of anti-racism protesters join Million People March in Notting Hill. The Independent. https://www.independent.co.uk/news/uk/home-news/million-people-march-protest-racism-notting-hill-blm-a9696506.html
Riga Airport. (2020). STATISTICS REPORT 2020. https://www.riga-airport.com/uploads/statistika/9_RIX_Statistics%202020_Okt.pdf
Wikipedia contributors. (2021b, January 19). COVID-19 lockdown in India. Wikipedia. https://en.wikipedia.org/wiki/COVID-19_lockdown_in_India
Wikipedia contributors. (2021b, January 15). Timeline of the COVID-19 pandemic in Japan. Wikipedia. https://en.wikipedia.org/wiki/Timeline_of_the_COVID-19_pandemic_in_Japan
NOS. (2020, November 23). NOS Archief: Nieuws. https://nos.nl/nieuws/archief/2020-11-23/
Time and date. (n.d.). Weather in november 2020 in Amsterdam, Netherlands. Retrieved 19 January 2021, from https://www.timeanddate.com/weather/netherlands/amsterdam/historic?month=11&year=2020
Simon Harris. (2020, December 14). itv News London Week 50 2020 [Video]. YouTube. https://www.youtube.com/watch?v=jlO4yuLDV50&t=209s&ab_channel=SimonHarris
Simon Harris. (2020a, August 17). itv News London Week 32 2020 [Video]. YouTube. https://www.youtube.com/watch?v=VWQPgRsRLRc&t=11s&ab_channel=SimonHarris
Shin, H. (2020, October 11). South Korea eases social distancing curbs amid COVID-19 downtrend. Reuters. https://www.reuters.com/article/health-coronavirus-southkorea-idUSKBN26W094
Roser, M. (2020, May 26). South Korea: Coronavirus Pandemic Country Profile. Our World in Data. https://ourworldindata.org/coronavirus/country/south-korea?country=KOR%7EJPN
Air traffic metrics
NARITA INTERNATIONAL AIRPORT CORPORATION. (2020a). NARITA AIRPORT TRAFFIC STATISTICS -2019(JAN-DEC). NARITA AIRPORT TRAFFIC STATISTICS - 2019(JAN-DEC). https://www.naa.jp/en/airport/pdf/statistics20200326.pdf
Incheon Airport. (2020). Incheon International Airport Statistics. https://www.airport.kr/co/en/cpr/statisticCategoryOfDay.do
STATISTICS REPORT 2019. (2020). https://www.riga-airport.com/uploads/files/Statistika/12_RIX_Statistics%202019_DEC.pdf
Isavia. (n.d.). Passenger statistics. Retrieved 11 January 2021, from https://www.isavia.is/en/corporate/about-isavia/reports-and-statistics/passenger-statistics/passenger-statistics
Heathrow Airport. (2020). Traffic Statistics | Heathrow. https://www.heathrow.com/company/investor-centre/reports/traffic-statistics
Airports Authority Of India. (n.d.). AAI TRAFFIC NEWS. Retrieved 6 January 2021, from https://www.aai.aero/en/business-opportunities/aai-traffic-news
NARITA INTERNATIONAL AIRPORT CORPORATION. (2020b). NARITA AIRPORT TRAFFIC STATISTICS -2020(JAN-DEC). https://www.naa.jp/en/airport/pdf/statistics20201224.pdf
Traffic congestion data
TomTom. (n.d.). TomTom | Home. Retrieved January 18, 2021, from https://www.tomtom.com/nl_nl/
